|
⇐ Previous Article — Table of Contents — Next Article ⇒
New Energy Times home page
3. Inexplicable D-D "Cold Fusion" Claims From Italy
By Steven B. Krivit
For 21 years, a subgroup of LENR researchers has hypothesized a D+D —> 4He + ~24 MeV (heat) “cold fusion” reaction to explain the excess heat and helium-4 measured in some LENR experiments.
Attempts to measure experimental values of MeV/4He were considered very important by the subgroup because the group members thought such attempts would help validate their hypothesis of a D-D “cold fusion” reaction in LENR experiments.
At the October/November 2004 11th International Conference on Condensed Matter Nuclear Science meeting in Marseilles, France, a group led by Vittorio Violante (ENEA Frascati) presented a graph (shown below) from its presentation "Review of Recent Work at ENEA," which claimed reasonable experimental agreement with the ~24 MeV prediction of the D-D "cold fusion" reaction. The graph shows the results of three runs of the group’s experiment C3. Violante gave a presentation with the same name on Aug. 23, 2004, to the Department of Energy and its LENR review panel.
New Energy Times contacted Violante for more information about this experiment and the data reported. He directed us only to the related paper "Some Recent Results at ENEA" and explained that it was published in the ICCF-12 proceedings. [1]
The graph below is, in fact, largely but not entirely illogical. The authors intended this slide to support their claim of reasonable experimental agreement with the prediction of the D-D "cold fusion" reaction. This article will examine and investigate the differences between the slide’s apparent meaning and its real meaning. (Click here for full-size image of the graph.)
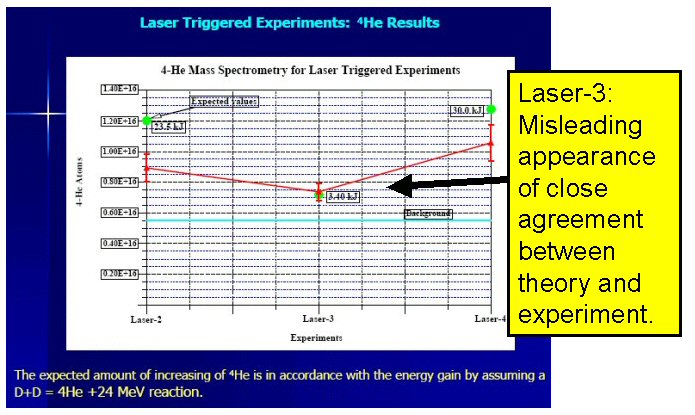
Fig. 1 - Violante group’s claim of reasonable experimental agreement with the prediction of the D-D "cold fusion" reaction. Presented at October/November 2004 ICCF-11 meeting in Marseilles. "Laser-3" experiment shows misleading appearance of close agreement between theory and experiment.
New Energy Times takes the graph at face value and assumes the following facts to be true:
- The green circles represent measured values of excess heat.
- As confirmed in the published paper, the measured values of excess heat are 23.5 kJ, 3.4 kJ and 30 kJ.
- The measured values of excess heat were obtained and reported rigorously.
- The label "Expected values" is illogical; the authors cannot have predicted how much excess heat the three runs of experiment C3 would produce. We assume it is wrong.
- The red triangles represent measured helium-4 produced in the experiment.
- The label "Background" and the light blue line are largely irrelevant to the issue of measured excess heat to the number of 4He atoms, assuming the experiment is well-isolated from the environment.
- The measured values of produced helium-4 are shown correctly on the graph. In the text of the paper, the authors did not state the helium-4 measurements in either the text or in a table; instead, they directed readers to this graph, identified as Figure 22.
- The values of the helium-4 shown on the graph were measured accurately.
- The measured values of excess heat are represented graphically in proportion to one another and are linear, despite the fact that authors failed to display the scale for excess heat.
- The value shown for 23.5 kJ is located incorrectly, assuming that the points for 30.0 kJ and 3.40 kJ are shown in the correct location and are displayed linearly.
- Ordinarily, two sets of data values are depicted on a single graph to show the relationship between the values.
- The plotted points for the helium measurement and the plotted points for the excess heat, as shown, have no relationship to each other, and they cannot and should not be compared.
- The plotted points for the helium measurement and the plotted points for the excess heat have a logical relationship (MeV/4He), and this relationship can and should be compared.
- In the six years this graph has been in the public domain, the authors have not announced any errors or retractions.
|
In an e-mail exchange with Violante on Jan. 24 and 25, 2010, New Energy Times explicitly asked Violante for the values of measured helium-4 because they were not specifically stated in the paper.
Violante provided ambiguous and conflicting responses to questions. After three unsuccessful attempts to get a straight answer from Violante, we decided to rely on the numbers in the graph. We read from the graph the following values of helium-4 atoms produced: 0.90, 0.72 and 1.05 E+16 atoms.
We also asked Violante twice to explicitly state his measured values of excess heat/helium (MeV/4He). The first time, he said he did not understand but gave the following puzzling response.
"The produced energy per event is 24 MeV," Violante wrote. "The expected values (green points) are estimated on the basis of such a value."
His response suggested he had concluded that the MeV/4He value for the heat measured in his experiment definitively was ~24MeV/4He. His dogmatic attitude was unfortunate, in light of the two decades of invective directed toward researchers in this field for being "true believers."
In an attempt to remove any potential ambiguity, we asked him a second time: "What are the measured MeV/4He values for Laser-2, Laser-3 and Laser-4?" He did not respond.
Nonetheless, we continued our analysis based on the excess-heat values stated in the paper, which match with the values shown in the text labels of the graph.
We calculate the heat per helium-4 atom and get 16.30, 2.95 and 17.83 Mev/4He. The data are shown below in Table 1.
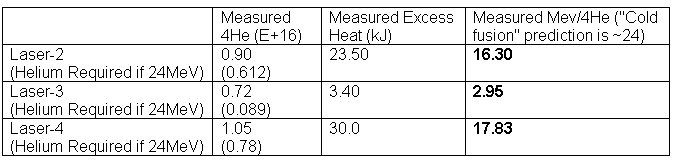
Table 1: Values of helium-4, excess heat from ENEA-Violante group’s experiment C3 series.
Based on this information and our assumptions, New Energy Times constructed a modified version of the Violante graph.
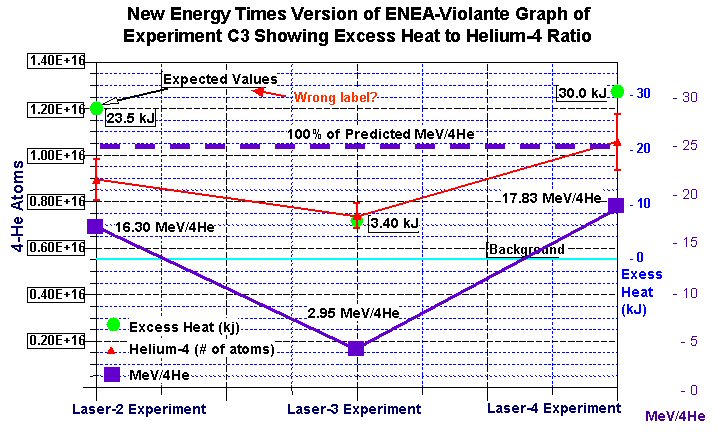
Fig. 2 - New Energy Times Graph Showing C3 MeV/4He
The first change we make is adding a scale for the excess heat based on the locations of Laser-3 and Laser-4 on the graph. Doing so shows the baseline for excess heat at or near the same level as the blue line associated with the label "Background." We find the location of the baseline for the excess heat illogical.
Next, we add a scale for MeV/4He and plot those values. For good measure, we plot a dotted line to show the Violante group's 24 MeV prediction of MeV/4He based on the D-D "cold fusion" hypothesis. An entirely different picture begins to emerge.
The Violante group's version, based on the Laser-2 run for example, shows the appearance of agreement between the prediction of the D+D —> 4He + ~24 MeV "cold fusion" reaction and experiment. However, the group’s own data contradict that claim.
To illustrate how far away the measured values for Mev/4He are from the hypothesized ~24 from the D-D "cold fusion" reaction, we calculate the relationship of measured to predicted values: 68.48%, 12.38% and 74.93% of 24MeV. These are shown in Table 2.
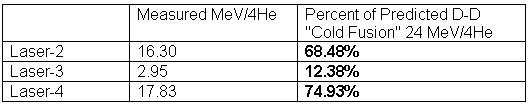
Table 2: ENEA-Violante experiment C3. Measured MeV/
4He vs. MeV/4He predicted by the D-D "cold fusion" reaction.
In the case of the second value, the measured MeV/4He being only 12.38% of the "cold fusion" prediction is inexplicable, given that the relationship displayed on Violante's graph gives the impression of a close agreement.
Even if we assume that "background" is somehow relevant, and it has not yet been subtracted from the helium values displayed on the graph, it does not improve the authors' case.
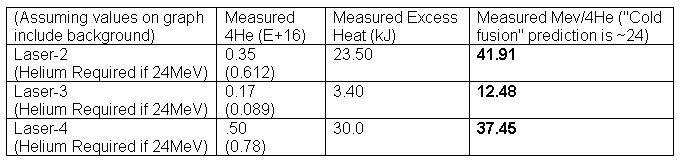
Table 3: Values of helium-4, excess heat from ENEA-Violante group’s experiment C3 series with 0.55 ppm "background" subtracted.
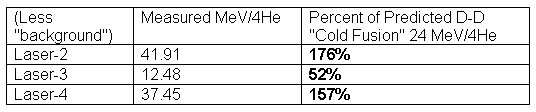
Table 4: ENEA-Violante experiment C3. Measured MeV/4He vs. MeV/4He predicted by the D-D "cold fusion" reaction with 0.55 ppm "background" subtracted.
Six months after the Violante group presented the graph at the Marseilles ICCF conference, it added new text to the graph, as shown below.
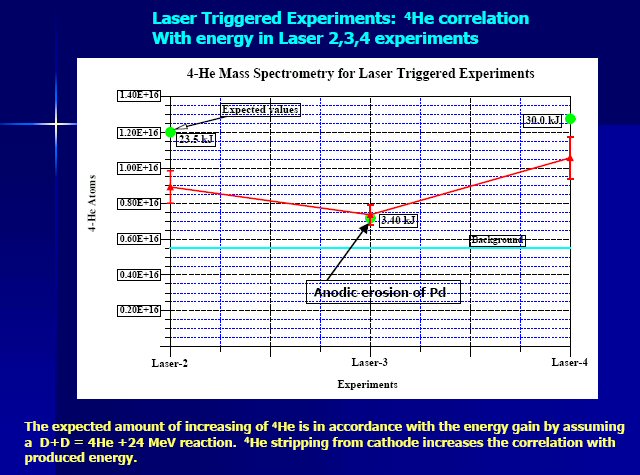
Fig. 3 - The graph shown by the Violante group at American Physical Society meeting in March 2005 states, "The expected amount of increasing of 4He is in accordance with the energy gain by assuming a D+D = 4He + 24MeV reaction. 4He stripping from cathode increases the correlation with produced energy."
The new label on the above chart, "Anodic erosion of Pd," incorrectly implies that the large underlying difference between the researchers’ theoretical prediction and their experiment for Laser-3 is coherently explained by the helium retention hypothesis invented by SRI and MIT researchers. Unfortunately, in the previous article, "The Emergence of an Incoherent Explanation for D-D "Cold Fusion," we showed that hypothesis to be unsupported and contradicted by more than 100 years of experimental evidence.
Violante told New Energy Times that experiment C3 was performed in June 2004. Two months later, at the invitation of the SRI and MIT researchers, he presented his recent (at the time) results at the Aug. 23, 2004, Department of Energy LENR review.
Because SRI researchers were co-authors of Violante's 2004 presentation and 2005 paper and because DARPA funding, through SRI, made its way to ENEA through a collaborative relationship between SRI and ENEA, the Violante group may have been influenced by the erroneous helium retention hypothesis of the SRI and MIT researchers.
This ENEA experiment clearly shows production of helium-4 as a result of some nuclear process, and it shows clear evidence of excess heat. However, the measured data does not support the claim that it provides strong support for the hypothesized D-D "cold fusion" reaction.
On Jan. 25, 2010, this writer e-mailed Violante and asked for the measured values of helium produced from experiment C2.
We received a confusing answer. On Jan. 25, 2010, this writer again e-mailed Violante, asking, "What is the amount of helium produced from Laser 2, 3 and 4 experiments?"
Violante answered, "For the three points in the plot, we have: 0.35E+16, very close to 0.1E+16 (not well drawn in the plot) and 0.50 E+16 atoms respectively. This means 19.22, 3.4 and 13.5 KJ. He[lium] recovery for points 1 and 3 is around 60%."
This writer requested the values a third time: "How much new helium was measured in Laser-2, 3 and 4. I do not want to know what is in the plot. I do not want to know how much you expected."
Violante responded, "In terms of new atoms the result is an amount of He[lium] ranging from 1E+15 up to 5e+15 atoms. This is obviously a preliminary result that needs additional research work."
This writer responded to Violante, reminding him that he had, since 2004, represented the measurements of helium-4 atoms from this series of experiments in the range of E+16 and that now he was stating to this reporter that his group had measured helium-4 atoms only in the range of E+15 atoms.
This sudden change — an entire order of magnitude smaller — is inexplicable, given that the authors have not announced any errors or retractions about this graph in the last six years.
New Energy Times asked Violante one additional question: "Is there any comment you would like to make, not about the preliminary nature of the research but about your published representations of this experiment to the scientific community?"
As we went to press, New Energy Times had received no response from Violante.
[Correction: We wrote that Violante restated his claims “an entire order of magnitude smaller.” This is incorrect. 1E+15 is the same as 0.1E+16. We made three attempts to get a clear answer from Vittorio Violante to our question about the specific values of helium measured by his group. In his second response, Violante gave us values expressed in E+16. In his third response, he changed to values expressed in E+15. On receipt of this third response, we failed to notice that he had moved the decimal point, and we were thus led to believe there was an order of magnitude difference in what he was stating. However, our mathematical error has no bearing on the significant misrepresentation by Violante’s group (see our Fig. 2 in the article.)]
Reference
1. Apicella, M., Castagna, E., Capobianco, L, D'Aulerio, L., Mazzitelli, G., Sarto, F., Rosada, A., Santoro, E., Violante, V., McKubre, M. C. H., Tanzella, F., Sibilia, C, "Some Recent Results at ENEA," Proceedings of the 12th International Conference on Condensed Matter Nuclear Science. 2005. Yokohama, Japan.
⇐ Previous Article — Table of Contents — Next Article ⇒ |